Author
László Ketskeméty
Mini Project ID
BMEMPBEER2
Description
What are the data needed to answer the following final questions:
- By building a given liqueur production capacity, assuming a given market price, in how many years can a total revenue of EUR 120000 be achieved?
- The use of malt stock for liqueur production trivially reduces brewing capacity. Is the question worth asking in what proportion is it worthwhile to distribute the quantity of malt among the three products in order to obtain maximum profits?
Distribution must also take into account market constraints, i.e. realizable selling prices. The selling price is seasonal, beer is sold in summer, and liqueur is sold in the winter semester. It is therefore worth making a separate calculation for the summer and winter semesters. The question can be answered by solving two different linear programming problems. - Obtaining permits is a very complex task. Consider outsourcing the task of this issue from the brewery to a law firm. It is advisable to carry out the contract within the framework of a public procurement procedure.
- The issue will be clarified after appropriate market research. A possible increase in the quantity reserved in the contract should be negotiated with the malt grower. New producers must be sought from whom malt can be obtained in the best possible way. Once you know how much malt is available and at what cost, this data can be taken into account in the mathematical model.
- This issue should also be outsourced to an advertising agency selected through a call for tenders. They then choose the most optimal promotional techniques within their own remit.
- The final version of the packaging form of the new product will have to be developed by a special statistical method, conjoint analysis. Several variants need to be ordered from the design studio, which needs to be tested with consumers. Consumers give scores to questions about the appearance of the product, which can be analysed with conjoint analysis, revealing consumer expectations. The final decision will then have to be made.
Sector
VET
Data
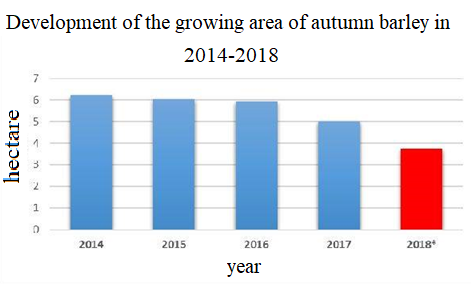
Figure 1. Development of the growing area of autumn barley in 2014-2018
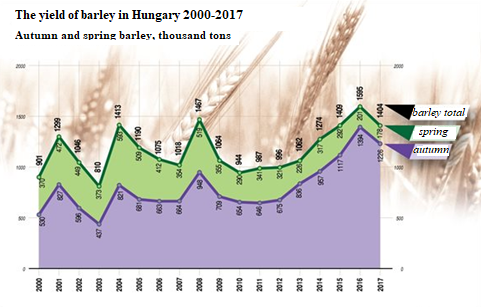
Figure 2. Barley yield in Hungary (2000-2017)
Autumn and spring barley, thousand tons – photo: KSH / MTI
| The selling price of barley (2007–2018) | ||||||||||||
| Euro/100 kg | ||||||||||||
| The absolute prices in this table provide information on the producer price of a given product. Prices are without VAT. | ||||||||||||
| 2007 | 2008 | 2009 | 2010 | 2011 | 2012 | 2013 | 2014 | 2015 | 2016 | 2017 | 2018 | |
| EU–28 | .. | .. | .. | .. | .. | .. | .. | .. | .. | .. | .. | .. |
| County | .. | .. | .. | .. | .. | .. | .. | .. | .. | .. | .. | .. |
| Belgium | 17,96 | 13,21 | 8,64 | 14,74 | 17,35 | 21,61 | 17,32 | 13,9 | 14,23 | 11,82 | 13,22 | 17,76 |
| Bulgarian | 12,33 | 14,57 | 10,55 | 10,05 | 16,02 | 19,33 | 17,09 | 15,33 | 15,5 | 14,07 | 13,71 | 14,96 |
| Czech Republic | 14,17 | 20,43 | 11,33 | 12,33 | 18,03 | 20,04 | 20,82 | 19,39 | 16,61 | 14,91 | 14,51 | 15,28 |
| Denmark | 17,76 | 19,98 | 12,62 | 13,16 | 19,6 | 21,29 | 19,03 | 15,09 | 16,16 | 13,73 | 14,79 | 17,28 |
| Germany | .. | .. | .. | .. | .. | .. | .. | .. | .. | 12,6 | 13,61 | 16,55 |
| Estonia | 15,42 | 13,7 | 9,82 | 12,5 | 17,2 | 19,01 | 16,51 | 16,5 | 14,88 | 12,76 | 13,56 | 15,73 |
| Irish | .. | .. | .. | .. | 18,79 | 21,23 | ..b | ..b | ..b | ..b | 15,36 | 22,27 |
| Greek | 22,48 | 20,95 | 14,12 | 16,29 | 20,45 | 20,46 | 19,6 | 16,14 | 16,72 | 16,2 | 15,83 | 15,61 |
| Spanish | 18,36 | 16,97 | 12,47 | 15,03 | 19,48 | 22,33 | 18,07 | 16,74 | 17,4 | 15,13 | .. | .. |
| France | 16,72 | 14,9 | 8,99 | 13,42 | 20,05 | 31,69 | 27,46 | 24,3 | 24,4 | 21,3 | .. | .. |
| Croatia | .. | .. | .. | .. | 20,04 | 17,64 | 16,55 | 16,21 | 15,73 | 13,15 | 13,45 | 14,91 |
| Italy | .. | .. | .. | .. | .. | .. | .. | .. | .. | .. | .. | .. |
| Cyprus | .. | 23,5 | 14 | 13,3 | 23,3 | 24,4 | 23,6 | 23 | 18,6 | 29,7 | 20,7 | .. |
| Latvia | 16,7 | 13,23 | 8,79 | 13,11 | 16,79 | 19,92 | 16,23 | 12,96 | 13,3 | 12,16 | 12,72 | 16,19 |
| Lithuania | 18,23 | 14,65 | 9,19 | 12,92 | 17,87 | 20,02 | 17,78 | 14,01 | 14,35 | 12,83 | 13,8 | 17,06 |
| Luxemburg | 17,1 | 10 | 7,67 | 12,53 | 16,11 | 20,03 | 14,7 | 13,02 | 14,21 | 11,3 | 12,52 | 15,18 |
| Hungary | 15,07 | 14,33 | 9,53 | 10,64 | 17,82 | 18,93 | 15,68 | 13,98 | 13,51 | 11,79 | 11,69 | 13,46 |
| Malta | .. | .. | .. | .. | .. | .. | .. | .. | .. | .. | .. | .. |
| Nederland | .. | .. | .. | .. | .. | .. | .. | .. | .. | .. | .. | .. |
| Austria | .. | .. | .. | .. | .. | .. | .. | .. | .. | .. | .. | .. |
| Poland | 16,94 | 18,33 | 9,49 | 12,31 | 18,37 | 19,63 | 17,53 | 15,06 | 14,63 | 13,39 | 14,43 | 15,88 |
| Portugal | 17,76 | 21,91 | 14,09 | 14,04 | 19,53 | 21,55 | 20,16 | 19,37 | 19,61 | 18,99 | 17,78 | 19,21 |
| Romania | 20,1 | 21,75 | 13,44 | 13,77 | 21,47 | 22,43 | 23,53 | 20,25 | 19,35 | 17,82 | 16,85 | 17,58 |
| Slovenia | .. | 15,94 | 10,46 | 10,84 | 18,08 | 17,96 | 17,73 | 15,33 | 13,38 | 13,3 | 12,88 | 14,24 |
| Slovakia | 17,02 | 17,79 | 12,74 | 13,52 | 19,01 | 19,69 | 19,06 | 16,65 | 15,14 | 13,97 | 15,36 | 13,97 |
| Finland | 14,58 | 16,07 | .. | .. | .. | .. | .. | .. | .. | .. | .. | .. |
| Sweden | 19,45 | 14,98 | 8,57 | 14,36 | 17,61 | 18,84 | 15,95 | 13,8 | 13,22 | 12,43 | 12,94 | 19,05 |
| Great Britain | 16,94 | 15,65 | 10,37 | 12,39 | 17,88 | 20,64 | 18,6 | 14,89 | 14,41 | 12,46 | 13,77 | 16,57 |
Table 1. Sales price of barley in the EU (2007-2018), Euro / 100 kg
BASIC Plant data
Quantity of raw material required to produce one barrel of product in kg:
| barley | hops | malt | |
| light beer | 1 | 1 | 2 |
| dark beer | 2 | 1 | 1 |
| liqueur | 0,5 | 3 | 3 |
The prices of the products are also different. Realizable price per barrel in euros:
| light beer | 45 € |
| dark beer | 50 € |
| liqueur | 60 € |
Available stocks of raw materials in tonnes and purchase price in EUR / glaze:
| barley | 4 tons | 14 EUR/glaze |
| hops | 2 tons | 30 EUR/glaze |
| malt | 5 tons | 20 EUR/glaze |
Cost of production of products from raw materials per barrel in euros:
| light beer | 0,14+0,3+0,4=0,84 |
| dark beer | 0,28+0,3+0,2=0,78 |
| liqueur | 0,07+0,9+0,6=1,57 |
Technological production costs in euros per barrel:
| light beer | 15 |
| dark beer | 20 |
| liqueur | 31 |
Other costs (other additives, packaging, storage, transport, advertising, etc.)
| light beer | 8 |
| dark beer | 8 |
| liqueur | 12 |
Net realizable profit per product in euros:
| light beer | 45-23,84=21,16 |
| dark beer | 50-28,78=21,22 |
| liqueur | 60-44,57=15,43 |
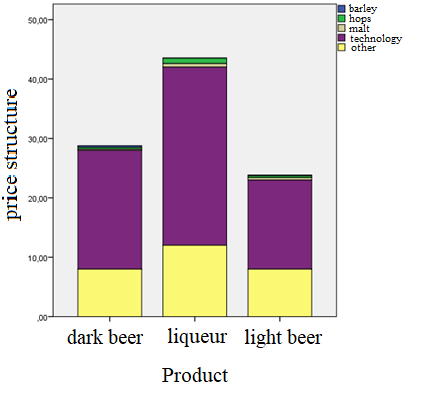
Figure 3/a. Structure of the producer price composition of the products
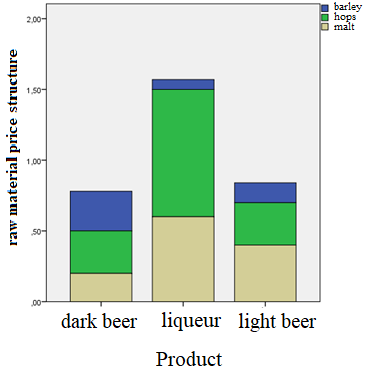
Figure 3/b. raw material price structure
Model
N/A
Calculation
N/A
Review M2S1 – DUCK beer.
You must be logged in to post a review.