
Author
László Ketskeméty
Mini Project ID
BMEMPBEER2
Description
In principle, if random processes develop, the optimistic model provides the greatest profit and benefit. However, this is only worth embracing if the firm have enough reserves to do it. If there are not enough reserves, the model for pessimistic estimates should be chosen.
What model shoud be developed?
Sector
VET
Data
Available in 2.1
Model
Geometric solution,
simplex method
Calculation
When preparing the design plan, mark x1, x2, x3 the quantities to be produced from each product per barrel, respectively. x1 for light, x2 for dark, x3 for malt liqueur.
The goal of management is to achieve maximum revenue, i.e. to maximize the z function. The data in the restrictive conditions were after all taken from average estimates because the financial background was considered to carry only medium risk.
z = 45x1 + 50x2 + 60x3 -> max, where z is the revenue of the brewery.
Due to raw material restrictions, the following relations must exist:
x1 + 2x2 + 0.5x3 4000,
x1 + x2 + 3x3 2000,
2x1 + x2 + 3x3 5000
x1, x2, x3.
Without the malt liqueur, the production plan with the same data would have been as follows:
z = 45x1 + 50x2 → max,
x1 + 2x2 4000,
x1 + x2 2000,
2x1 + x2 5000,
x1, x2.
In this model, they do not calculate setting limits that are more sophisticated on the amount of the two beer products. Namely, a lower and upper limit could be set for the quantities x1 and x2. The lower limit would express the minimum amount that should be produced, and the upper limit would be the data that depends on the market capacity and the marketability of the product. By setting these limits, of course, we would get a different result for the optimum.
So far, no analysis has been performed to optimize product structure, but the current production plan is also being reviewed in connection with product expansion: is the current production program the most optimal in terms of revenue?
This design can be solved by simple elementary geometric methods. This is because the constraint inequalities define a triangle in the positive quadrant of the plane (x1, x2):
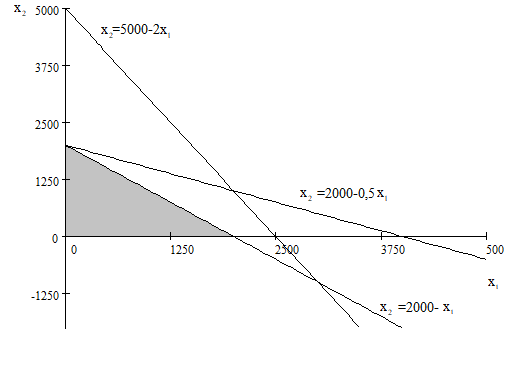
Figure 4. The triangular range defined by the constraint conditions
The objective function z can only take its maximum at one of the vertices of this triangle.
The three vertices are (0,0), (2000, 0) and (0, 2000). The objective function z takes the largest value in the third of them, which is z max = 50 ∙ 2000 = 10,000 (euro).
In the case of two products, the factory can produce the greatest revenue if it only produces brown beer from the raw materials! This surprised the investigators as they have been working spontaneously on a different production plan so far!
Then they calculated what the result would be if they considered malt liqueur as well!
Now it is not possible to illustrate in two dimensions the range of interpretation of the revenue function z, which is determined by the constraint conditions, since the set of possible solutions falls in the positive eighth of the space (x1, x2, x3). It is a three-dimensional convex shape bounded by planes, at one of the vertices of which can occur the only maximum of the function z. In our case, the interpretation range is bounded by 6 planes. The number of planar triplets ![]() , each defines three vertices, so a total of 60 vertices are formed. Thus, in the convex polyhedron, which is entirely in the positive space octave, it has a total of 3 20 = 60 vertices. One of them is the peak that forms a maximum in z! Defining 60 peaks is a tedious and not an “elegant” solution.
, each defines three vertices, so a total of 60 vertices are formed. Thus, in the convex polyhedron, which is entirely in the positive space octave, it has a total of 3 20 = 60 vertices. One of them is the peak that forms a maximum in z! Defining 60 peaks is a tedious and not an “elegant” solution.
The simplex method is used to find the optimal peak. Starting from the origin (where the value of z is 0 by definition), we move to a point in each step where the value of z is guaranteed to increase. The value of z increases in each step of the algorithm. In a finite number of steps (well less than 60 steps), we get to the peak that provides the maximum.
In our case, the specific calculations are performed with elementary base exchanges.
Producing each of the basic solutions and then selecting the optimal basic solution seems obvious, but the number of basic solutions (in our case it is “only” 60) requires unacceptably high computing power in practical cases. The simplex method is an efficient, cost-effective method for selecting the optimal base solution.
The simplex method developed by Danzig moves from one basis solution of the normal problem, usually from the solution x = 0, to an iterative step to another basis solution with a higher objective function value than the previous one. The optimal solution is found if the method does not offer an additional basis solution with a higher objective function value. Each step of the simplex method can be followed through sequentially generated tables from the starting table. Tables can also be called simplex tables.
Steps of the simplex method
- From the initial table we read the basic solution. We determine the value of the objective function.
- If possible, add an additional column vector of the coefficient matrix A to the basis to increase the value of the objective function.
- After the base change, we read another base solution. We determine the value of the objective function.
- If the value of the objective function cannot be increased, we have found the optimal solution.
We write the starting table from our data and then perform the elementary base exchanges. In the tables the red number, the so-called generating element.
| x1 | x2 | x3 | b | |
| u1 | 1 | 2 | 0,5 | 4000 |
| u2 | 1 | 1 | 3 | 2000 |
| u3 | 2 | 1 | 3 | 5000 |
| -z | 45 | 50 | 60 | 0 |
| u2 | x2 | x3 | b | |
| u1 | -1 | 1 | -2,5 | 2000 |
| x1 u2 | 1 | 1 | 3 | 2000 |
| u3 | -2 | 1 | -3 | 1000 |
| -z | -45 | 5 | -75 | -90000 |
| u2 | u1 | x3 | b | |
| x2 u1 | -1 | 1 | -2,5 | 2000 |
| x1 u2 | 2 | -1 | 5,5 | 0 |
| u3 | -3 | 1 | 5,5 | 3000 |
| -z | -40 | -5 | -62,5 | -100000 |
The end result develops in the third step: the optimal production program in that case is given if the brewery produces exclusively brown beer from the available material sources! The introduction of a malt liqueur product would not be economical for the time being! The factory needs to fill its warehouses with raw materials in order for the production of the new product to be profitable. Of course, if the recipes do not change, but the stock of raw materials or the prices of the products would change, another optimal production plan could come out with a method similar to the one discussed.
It would be advisable not to start from the general starting condition x1, x2, x3≥0, but to regulate the quantities with minimum and maximum limits:
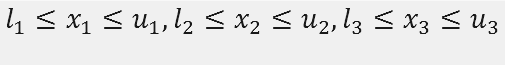
However, to the determinate of the regulatory lower and upper limits need to be carefully and thoroughly researched to circumstances. These will have to be determined using market research and economic methods.
Review M2S4 – DUCK beer.
You must be logged in to post a review.